In an effort to aid regional decision making, SugarBearAI, a software development group, has released a map reporting the most current death and infection outbreak figures in an easy to understand way.
Data Sources
The map pulls directly from county websites instead of relying on downstream counts from larger, more well known organizations who are themselves relying on this sort of data, but need an additional amount of time to process.
The project/web application to track intensity at a geographical level is linked here: http://chicano.press:5000, a name that references the California Mexican and Mexico City collaboration to develop the software.
UC Davis geographer, Alfonso Aranda (PhD), advised the development team to explore conventional and accepted ways for geographic data to be represented.
“Scale, maps and basic descriptions are needed for this data to be understood. Referencing official county figures directly, but pairing it with a widely understood map view cuts down on difficutlies for users.”
Alfonso Aranda (UC Davis)
As a result, the project chose to build their Covid19 case ranking application in a way that complemented the most commonly used map service in the world: Google Maps, according to Statista. Software engineers from the Autonomous Metropolitan University of Azcapotzalco – along with members from private industry -created an automated process to load the more recent and trustworthy data from counties. This contrasts greatly with the presentations eminating from large institutions removed from the local situation due to their physical locations.
The innovative map helps people make common sense judgments about whether a town is more or less highly ranked based on the number of infections.
Despite the intuitive way people are encouraged to assess whether a town is more or less exposed to the Covid-19 epidemic based off number of cases, Aranda cautions casual users that the map is a not a way to assess risk in the technical sense:
“This map is more like a ranking system, with specific points within the Southern California polygon standing in and colors (red through green) showing number of cases. Common sense judgments do not necessarily map towards standardized risk assessment tools. This isn’t an epidemiological risk assessment.”
Alfonso Aranda (UC Davis, PhD)
This ranking system is set for people to have a more intuitive way to compare other hotspots in the Southern California area. In a recording displaying basic functions, Southern California residents, particularly Spanish speaking Mexicans who are currently employed at higher rates, can navigate to avoid the coronavirus at a geographical level.
As many governors around the nation try to quell the infection, residents are confused because of the lack of a clear intuitive breakdown of relative risk for contracting the infection. This map likely helps pinpoint what area is more affected relative to their day to day commute or recreational activities.
Usage of Covid19 Infection Map
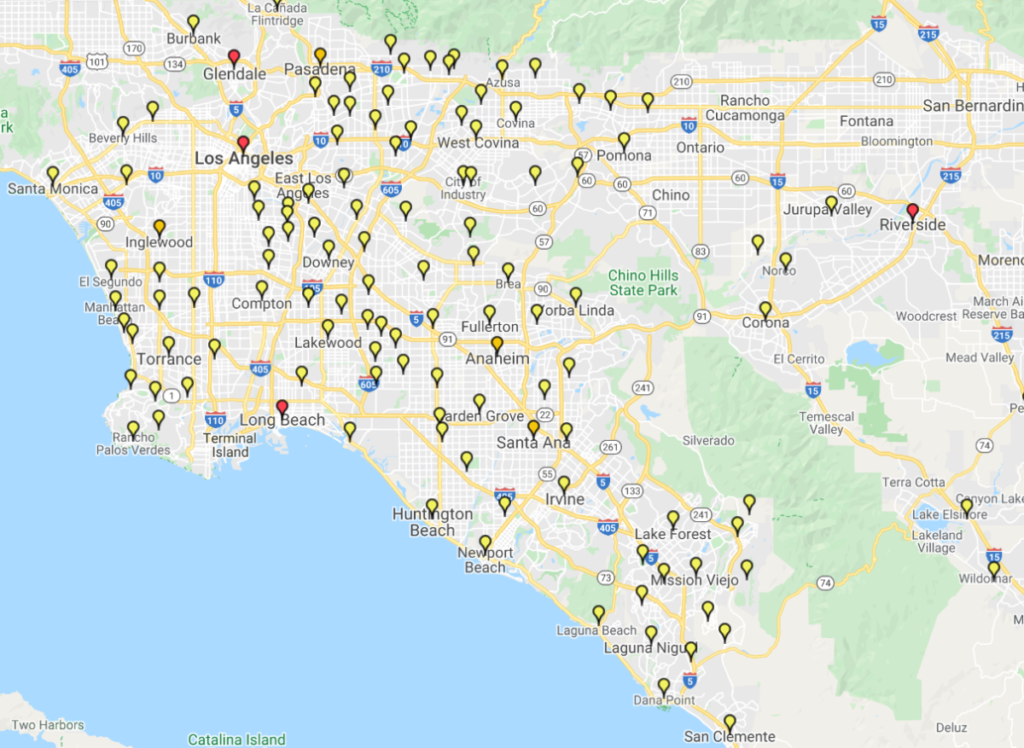
The map presents the relative intensity of Covid19 infections between different Southern California cities.
The higher the coronavirus infection count is within a Southern California city the closer to red (or somewhere between the green and red color scale) will the balloon appear over the city’s longitude and attitude center.
Red represents highest in the region, while Orange and Yellow represent respectively lower counts for the number of infections posted that day by the county. Green is for very few or zero counts.
More maps, intuitive and locally focused, may help those who understand the pandemic’s real health risk calculate risks better. The project aims to expand coverage should the public demand such an effort.
This article appeared in the SAWEEKLY.org